How to find values from one column that are missing in another. xlCompare can do this automatically in just a few clicks. It's one of the easiest ways to find differences between values in two Excel columns.
If you search Google or ask an AI assistant how to compare Excel columns, you'll usually be offered at least three options: using VLOOKUP, XLOOKUP, Conditional Formatting, or an online comparison service.
The first three methods are more complicated than using an online tool and often require Excel knowledge that many users simply don't have yet.
You might object to the online-service approach by saying: "I don't want to upload my data to someone else's server." In most cases, that concern is valid - but not with xlCompare.
The xlCompare online application works directly in your browser and does not send your data to the internet. We respect your privacy.
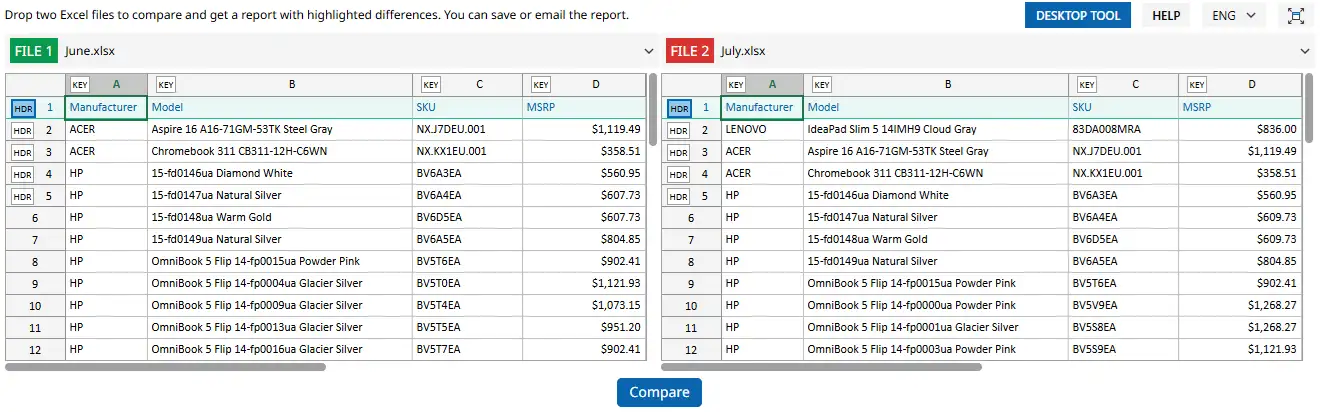
Below is a step-by-step guide showing how to find extra or missing values between two columns. In our example, we'll use two price lists synchronized by the SKU field. Our goal is to find differences between the SKU columns.
Drag and Drop Two Files onto This Page
To get started, drag and drop two files from File Explorer onto this page. Place one file in the left panel and the other in the right panel.
You can also paste data directly into the tables using the clipboard. This option is especially useful if your spreadsheets are stored in Google Sheets or use a format other than XLSX or CSV.
In our example, it looks like this:
Specify the Header Row and Key Column
You can skip this step if your table does not contain a header row. However, it is important to get accurate results. The header row gives xlCompare the field names from your table, while the key column tells the application which field should be used to match rows between the two tables.
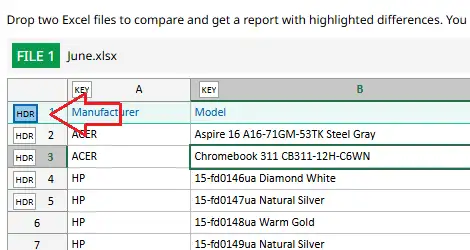
How to Select the Header Row
Click the HDR marker next to the row number. The selected row will be highlighted in blue.
In our example, the first row in each table is the header row.
What if there is no header row? Simply skip this step - it will not affect the comparison result.
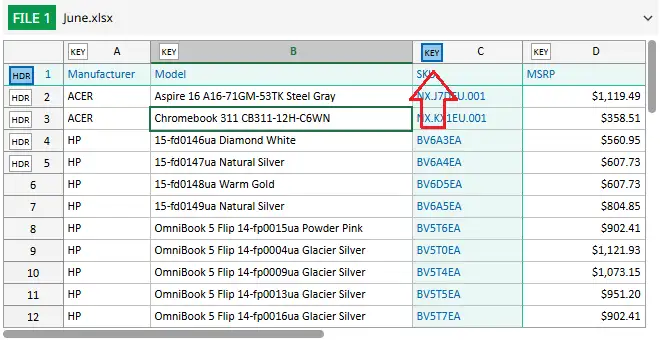
How to Specify the Key Column
Click the KEY marker in the column header. The selected column will be highlighted in blue.
In our example, we use the SKU column as the key field. This field uniquely identifies each row in the table.
In more advanced cases, the key can consist of multiple fields, such as first name and last name.
What if you are not sure which field to use as the key? Just skip this step. In that case, xlCompare will use a different algorithm to find differences between the tables.
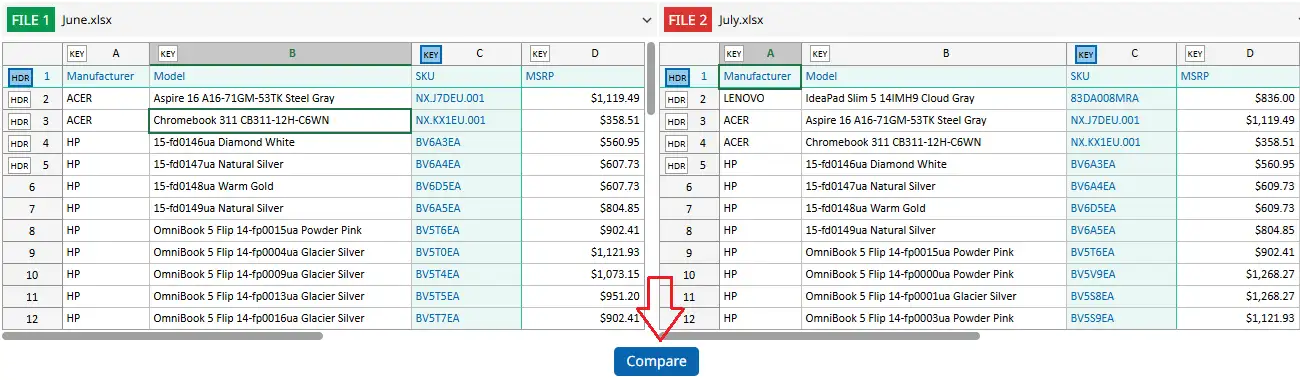
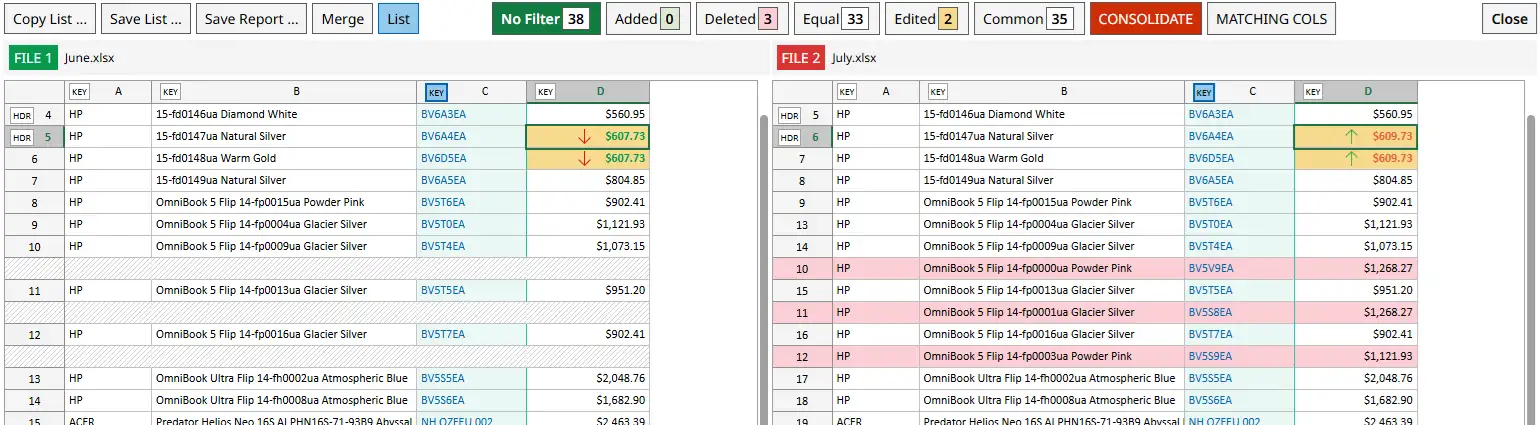
Compare the Two Tables
Click the Compare button located below the two tables to run the comparison and instantly see the results on the screen.
All differences between the two tables will be highlighted with colors for easy review.
Result is the following:
Find Differences Between Columns
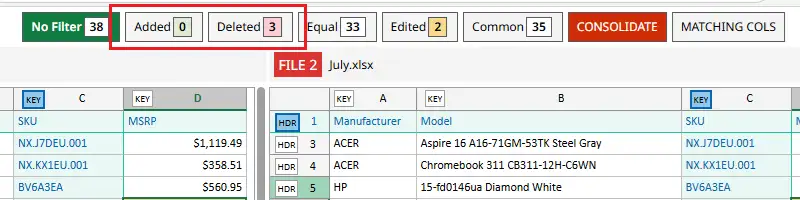
Above the comparison report, you will see the Legend, which displays the number of matching and different rows.
Select Added, and xlCompare will display only the rows whose SKU does not exist in the right-hand list. These rows are highlighted in green.
If you select Deleted, xlCompare will display the rows that are missing from the right-hand file. These rows are highlighted in red.
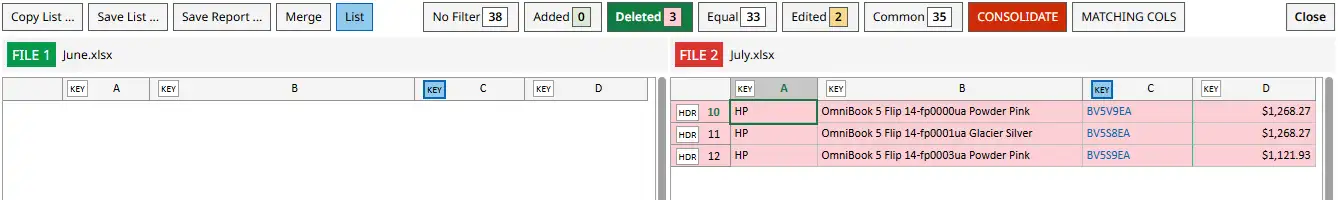
That's exactly what we need.
Save the Resulting List
The online version of xlCompare does not save files directly to your disk. Instead, it allows you to copy the resulting table and paste it into a new Excel file or Google Sheets document.
This is a simple and familiar way to transfer data between spreadsheets - even for beginners.
Right-click anywhere inside one of the tables.
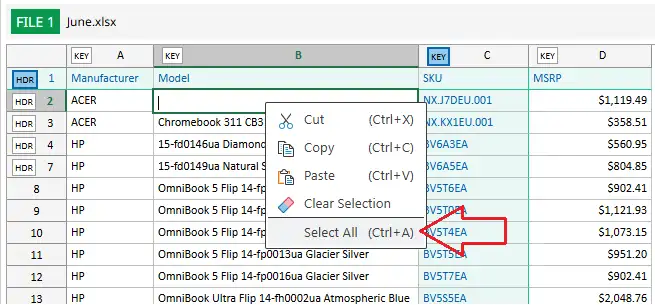
Click Select All in the context menu.
Right-click again and select Copy.
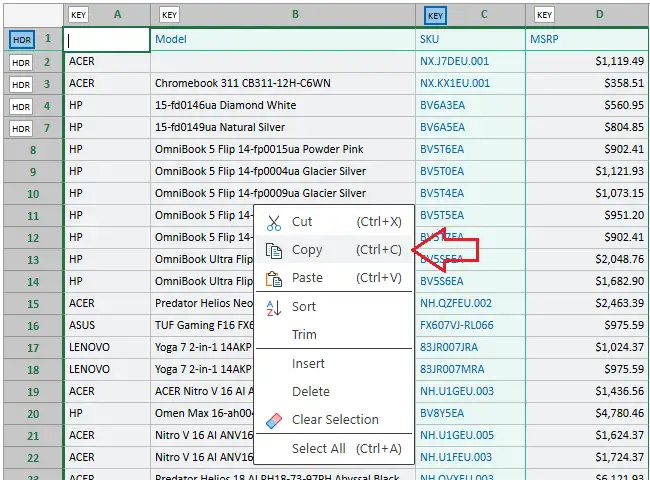
Done! The selected data is now stored in your clipboard.
You can now paste it directly into Microsoft Excel or Google Sheets.
You can also use keyboard shortcuts instead of the context menu:
- Ctrl+A - Select All
- Ctrl+C - Copy
Conclusion
As you can see, the entire task can be completed in just a few clicks.
Even if you are highly experienced with Excel formulas, functions, and advanced features, getting the result with 5–6 mouse clicks is faster and easier.
