One of the common questions of the Excel users: How to compare values in two columns? Or how to compare two lists of data in Excel and pull matching values? Microsoft Excel is the best in this business. It offers several features you can use to get results in seconds. Below are step-by-step instructions for various methods to compare cell values in columns in Excel.
How to compare two columns for matches and diffs in Excel
Contents
- Compare columns cell-by-cell
- Use EQUAL operator
- Use IF function operator
- Compare two unordered lists
- Use VLOOKUP function
- Use MATCH function
- Filter mismatching items
- Use Conditional Formatting
- Conclusion
- Benefits of choosing xlCompare
- Compare 2 columns step by step
- Find bold and colored cells
- Compare three columns at once
- How xlCompare can help you
Join Reddit Community
Compare values in two columns cell-by-cell
Let's start with the simplest case - you have two columns with a fixed structure. This is possible when you are working with a document that doesn't allow you to insert new values or remove them.
If this is not your case and you have two unordered lists of data on your worksheet, please go to the next topic.
But if you need to compare two columns on Excel worksheets for exact matches - here are the methods.
In this topic we use the following worksheet with 2 columns of data:

For the results of the comparison, we've reserved a third column. We are using common approach and just put the results into first empty column on the right of data.
Using Equal Operator
Probably, this is the most quick and simple method. We compare cell values in the first and second lists with EQUAL operator.
Select top cell in the result column (C2) and type = to start entering a formula into the selected cell.
Select top value in the first column (A2), type = and select top value in the second column (B2). Hit Enter. Formula in the C2 cell should look like =A2=B2.

Select cell C2 again and double click on the fill handle point. Excel creates the same formula in all cells in column C.

That's all. Now you have the results of the comparison on your screen.

If the cell in column C shows TRUE - values are equal, otherwise values are different.
Using If function
Let's customize the previous method with equal operator and make values in column C clearer.
Type the following formula in cell C2: =IF(A2=B2,"","NOT EQUAL").

Select cell C2 and double click on the fill handle frame.
Excel application fills column C with formulas that are like formula in C2.

Column C contains text "NOT EQUAL" near values that don't match. All other cells are empty.
Just in a few clicks you've compared two columns in Excel for differences.
How many cells are different
Again, this is very easy. Select cell D1 and paste following formula:
=COUNTIF(C:C,"NOT EQUAL")

Excel gives you the count of cells that contain NOT EQUAL string. This is a count of the different values in two columns.

Compare two unordered lists of data in Excel files
Now let's look at the more complicated case that often happens in the real business processes. There are two unordered columns that contain values to be compared.
We will show you how to compare them using very simple formulas.
Using VLOOKUP function to compare two columns
VLOOKUP function is a primary worksheet function you need to know if you are comparing data in Excel.
Select cell C2 and paste following formula:
=IFERROR(VLOOKUP(B2,$A$2:$A$8,1,FALSE),"")

IMPORTANT: Range of values to look in, in our case this is A2:A8 should be entered with dollar sign before every value - $A$2:$A$8.
Select cell C2 again and double click on the fill handle area.

Excel fills all cells in column C with a formula like this one.

Again, in just a few simple steps we've compared two lists in Excel for different values.
Using MATCH worksheet function to compare two columns
Another worksheet function you can use to identify mismatching values is MATCH.
Paste following formula into C2
=IF(ISERROR(MATCH(B2,$A$2:$A$8,0)),"NOT FOUND","")

Select C2 again and double click on the fill handle.
Column C displays NOT FOUND text for all cells in the column B that were not found in the column A

Filter matching and unique rows in two columns in Excel
Next our task is to extract matching items from both lists.
Select Column C and apply Filter command on the Ribbon.

Excel creates a filtering button on this column and adds it to cell C1.
Click on the filter button and uncheck the NOT FOUND item.

Excel filters all rows that have matching items in the other list.

As you see just in a few clicks you get matching values from two lists without extra efforts.
Highlight differences in two columns in Excel using Conditional Formatting
If you would like to have mismatching items highlighted, you need to use Conditional Formatting.
Conditional Formatting is a quick and easy method to change cell formatting depending on some conditions.
Select range that contains second list.
Use Add Conditional Formatting command on the Ribbon.

Select Use a Formula to determine which cell to format.
Enter following formula =ISERROR(MATCH(B2,$A$2:$A$8,0))

Do not forget to use dollar sign to specify range of values.
Use Format button to select desired formatting for the mismatching cells.
In our example this is White text with a Red background.
Press OK and get the results.

That's all. Mismatching values are perfectly highlighted.
Conclusion: How to compare 2 columns in Excel
As you can see in a few simple clicks you can find matching and different values in two lists of data on the Excel worksheet.
You don't need to use special ExcelDiff tools and create a Visual Basic macro.
This job is relatively simple and easy.
Even if you have a million rows, in a few seconds you will have a list of filtered and highlighted different values, using the instructions published above.
The methods we've presented: Formulas, Conditional Formatting, Filters can be used in a combination. You can not only highlight the changed values, but add a filter and pull data from the compared lists.
However, in the topic below we will present you with instructions on how to compare two Excel worksheets by key columns and filter and compared data.
If you have a more complex business case, you may find it useful.
Compare two lists of data in Excel with xlCompare
Excel files are widely used in many business processes as a method to store and transfer the information. Reports generated by various applications are often stored in Excel files. Data extracted from the database is usually saved as CSV, that is also one of the file formats supported by Excel. Ability to efficiently compare columns in Excel files is important. xlCompare is a tool that will save you a lot of working time. Time is valuable resource in the modern days.
Excel file comparison tool is an alternative to the Excel commands and options. xlCompare is capable to quickly process large unordered datasets and give you highlighted report for the equal and different rows.
Excel diff tool is a professional solution that greatly simplifies your work. Armed with xlCompare you can do your work in a minute, while other methods may cost you hours of work.
Below we describe the benefits you are getting the if you choose xlCompare as a tool to compare two columns in Excel.
What are the benefits of choosing xlCompare
xlCompare is an effective solution that compares columns in Excel files and present you a color coded comparison report. xlCompare is a robust and powerful utility that can be important part of your business process if you are using Excel in your daily work.
Let's talk about benefits you are getting and look how xlCompare works when you need to compare cell in two columns in Excel files.

Simplicity
xlCompare is very simple to use. We've made a lot of efforts to make the application as easy and convenient as possible.
xlCompare is divided into 2 panels to give you native representation of the comparison results. Comparison operations is our specialty.
Our team communicate with our customers on the regular basis. We are improving interface using your feedbacks to make it more user friendly. If regular Excel user says that there are no confusing commands in the application - this is perfect result for our team.

Effectiveness is a key benefit
Our primary goal is to make you effective. We don't just give you a tool that compares columns for differences in Excel files. We save your working time and prevent from errors. This is important difference. Our tool makes you effective. Actual value of xlCompare is amount of the time spent to spreadsheet comparison tasks multiplied by your hourly rate. And this doesn't include possible loss of profit due to spreadsheet errors.
Works with unsorted and unordered data
xlCompare perfectly works with unsorted and unordered worksheets. When you have a very simple spreadsheet, you don't need a tool to do your work. But in the real business process Excel file you are working with may have thousands of rows and millions of cells. In this case you need a professional solution that will greatly increase your effectiveness.
You don't need to learn Excel commands
With xlCompare you need to do only a few clicks to get the results. This is our goal - solve your tasks with minimum efforts from your side.
Off course you need to learn several simple commands in the tool. This a minimum you need to do to get your job done.
Compare only the data you need
xlCompare allows you to hide the data you don't need to be compared. Also you can ignore some columns and have them visible in the comparison report, but they doesn't produce any differences.
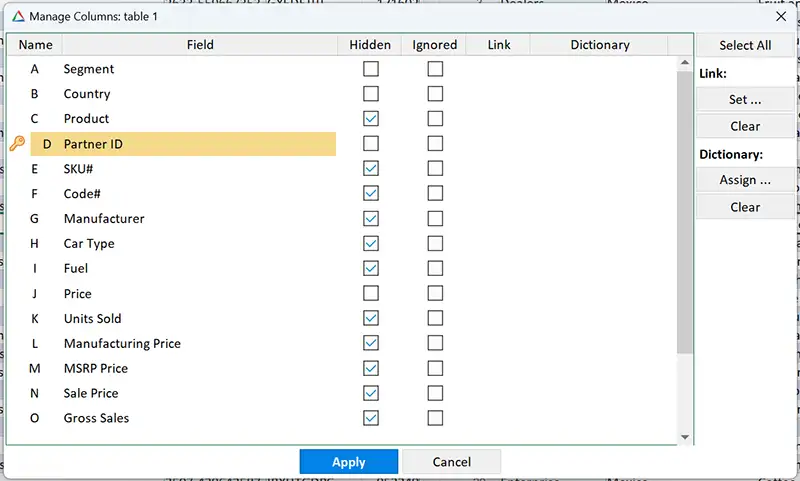
Manage Columns window is a place where you can hide and unhide columns. Here you can mark your columns as ignored and link one column with other.
This is easy and convenient interface that gives you a control over processed data.
Highlight matching and different rows
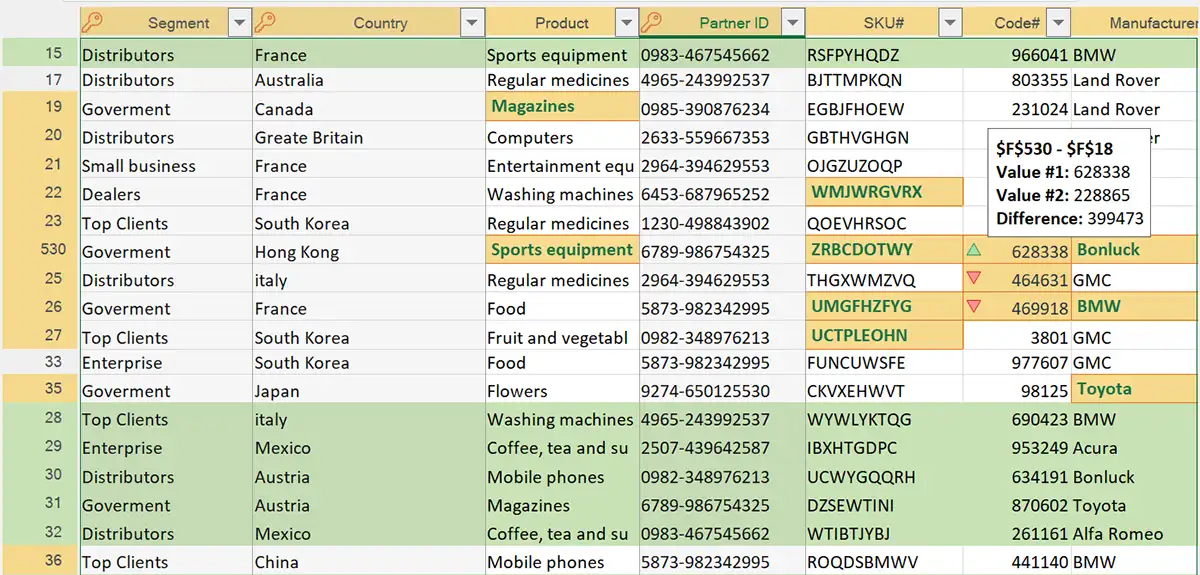
Comparison report highlights differences with background color and with text color. This highlighting is virtual, it is not present in the worksheet. xlCompare places it over the actual data to present differences to you.
Highlight Changed Cells command applies these highlighting options to the actual cells.
All colored cells you see in the report will be permanently highlighted in the Excel file. Color formatting makes unique and updated rows easily identifiable in the saved workbook.

Comparison Accuracy and Ignored Characters
xlCompare is very flexible. You can setup accuracy to ignore minor changes in the numeric values. Or ignore some characters if data in one column doesn't match exactly.
Save changed rows on the other sheet
Very often you need to extract duplicate rows between two worksheets. Or you've filtered a subset of your data and it should be saved for future processing.
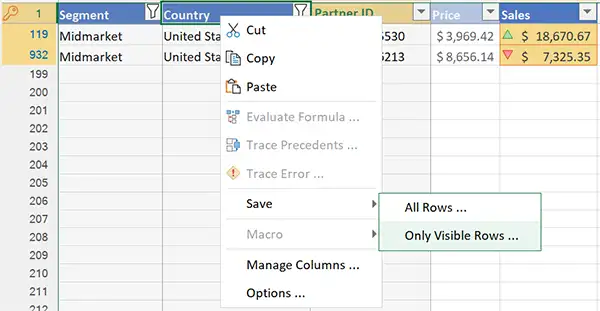
xlCompare has very handy commands in the right click menu:
Save | All Rows
This command saves all rows on this worksheet into separate Excel file.
Save | Visible Rows
This is a perfect way to extract data from the worksheet. After you've filtered the data you need, just use command to save this subset of rows in disk.
Just in one click you have your data exported into external file, that can be emailed, uploaded into cloud, etc.
Populate another sheet with missing values
Do you need to add missing values from another column into your sheet?
xlCompare has set of merging commands that populates one worksheet with values from another sheet.
Merge | Insert Rows From Left
This command inserts all unique rows from the left file into appropriate positions in the right file.
Merge | Insert Rows From Right
Similar command that populates left worksheet with rows marked as new in the right file.
Filter your worksheets to analyze specific segments of data
xlCompare supports table and filters, that you setup in the Excel files. Filter is a perfect way to manage your table by showing only the rows you need.
In the comparison report mode xlCompare synchronizes filters and gives you a way to quickly get a specific segment of data on your screen.
For example if you need to find updates in the Segment named Midmarket - just filter comparison report by this segment.
Next step - filter Midmarket segment by Countries and so on.
According to the previous topics, just in one click you can export filtered data into other file including highlighting.

Compare two columns in Excel file and highlight the differences
xlCompare is an efficient tool that compares two columns in Excel files for the differences. Armed with xlCompare you get matching and duplicate values in two Excel columns. Extract equal and unique cells and more.
Let's see xlCompare in the action. We will show you how to compare two columns in Excel files using xlCompare and extract matching and different records.
This a short demo of the xlCompare. If you need more information or more comprehensive demo, please contact us. We will be happy to present you our product and answer to your questions.
Open your files in xlCompare
To start using the tool you need to open your files in the xlCompare. There are several commands you can use. You can use File | Open command on the Ribbon, or browse form file button on the main window. But we recommend to just drop your workbook into the xlCompare window from Windows Explorer. This is quick and easy way to get your files opened in the xlCompare application.
xlCompare immediately asks you to compare opened files. Our purpose is to compare two columns, so we just close this Comparison Wizard window and back to our worksheets.

Analyze data for possible key columns
First of all, you need to visually check your data for Primary Keys. This is important part of the process that may lead to incorrect comparison results.
What is a key column
Key column is a column, that is used to identify record in the table. xlCompare allows to create complex keys that contains several columns.
Also, data in the key columns should not be unique. Normally database table requires key value to be unique in the table. But on practice most of the Excel files you are working with contains duplicate values of the key.
For example, you have Partner ID column in the left worksheet that contains identifiers of the partner company. You may have several records for the same partner in table.

Define key columns
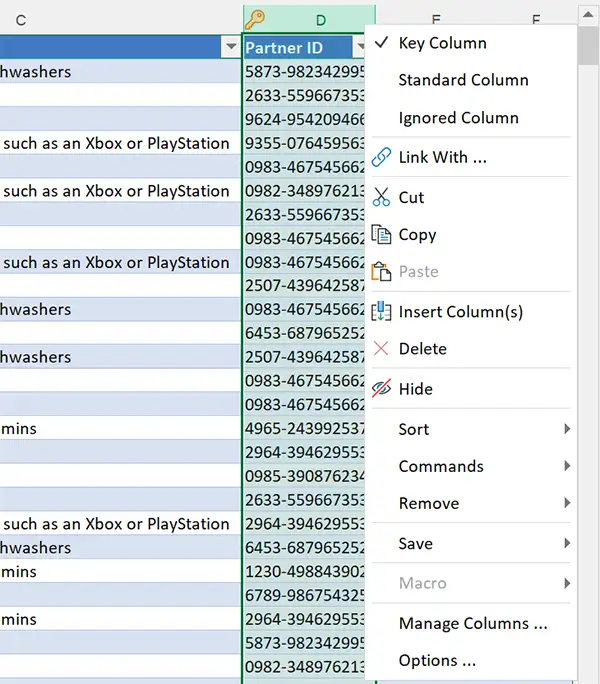
To mark your column as key, please select column, do right click on the heading and use Key Column item in the right click menu.
Your column receives Key icon in the heading.
Setup heading rows
Usually, tables stored in Excel worksheets have heading rows. Heading row contains Field names for the table columns.
This row is highly important to getting correct and accurate results.
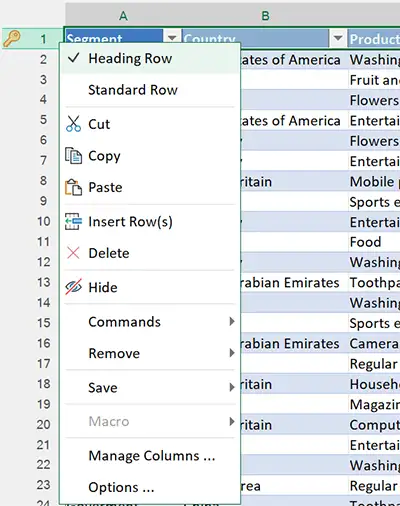
xlCompare tries to identify heading row and mark it with Key icon in your file. But at the any moment you can right click on the row heading and mark specific row as a header of your file.
Select columns to be compared
Image, that in our case we would like to compare data in the Sales column for a specific partner company, taking into account marketing segment and country.
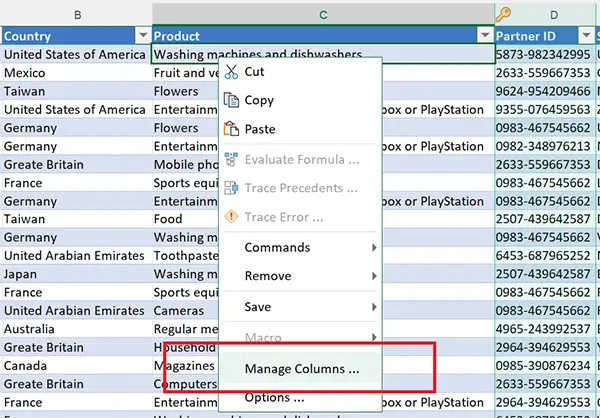
Right click on the worksheet and use Manage Columns command.
This window is a way to manage data in your worksheet and select what would you like to compare.
Hide the unimportant data
We would like to have only a few columns on screen to be focused on the data.
Click on the Hidden word in the heading to hide all columns. Now we uncheck items we would like to have in the report.
We choose following columns in our example:
- Segment
- Country
- Partner ID
- Price
- Sales
Ignore columns you don't need
Note, that we would like to have Price column just for the information. It should not be compared with corresponding column.
Check the Ignored mark for this column.

Link columns on the worksheet
Very often you compare data received from the different sources. So, fields in your tables may have different names. Like in our example, left worksheet has field Partner ID and right one has same data in the PID field.
Select Partner ID column in the Manage Columns window and use Link | Set button to bind it with PID column.
Can application do it for you. Probably yes, but you better know what data you would like to compare. Also, this is a way to have a control over the application and force it to use a specific link.
Remember, that you need to do this only for the fields with different names. We don't need to link any other columns like Segment and Country.

Compare selected columns on two sheets
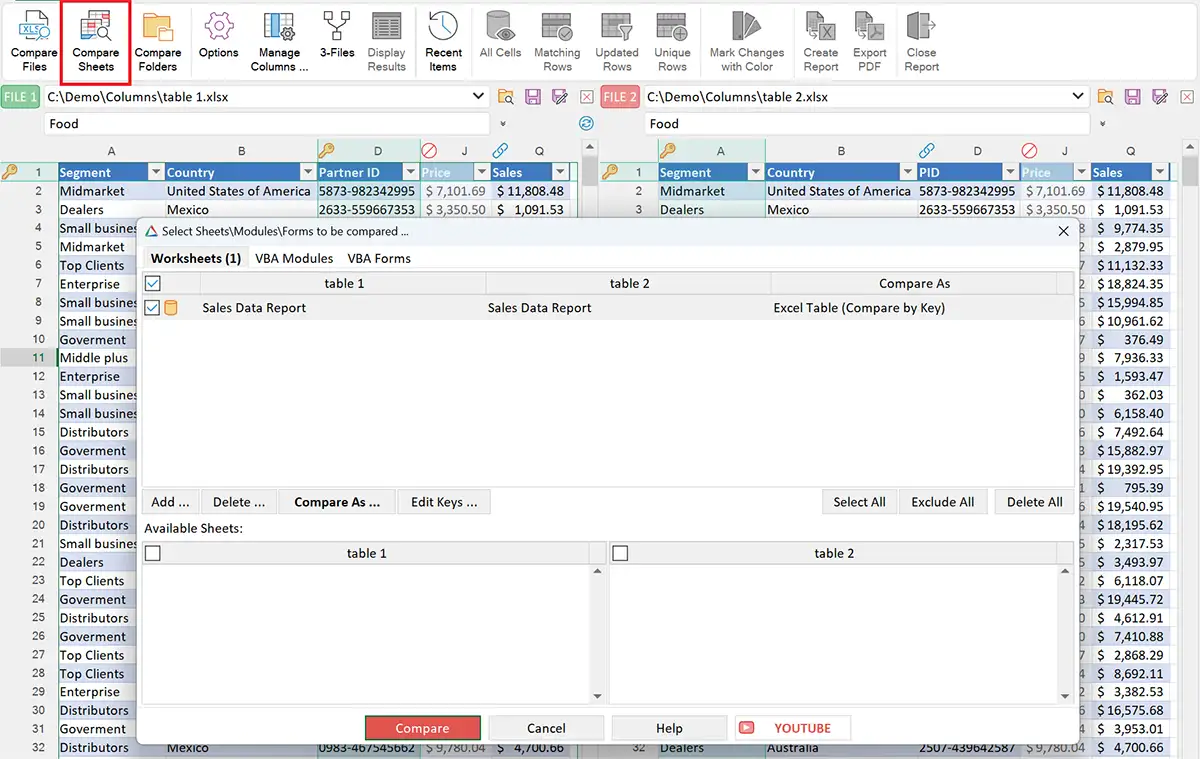
We are ready to compare two columns for different values. Use Compare Sheets command on the Home tab on the Ribbon.
It brings you Comparison Wizard window.
Close it by using Compare button and go to the comparison report.
Understanding the comparison report
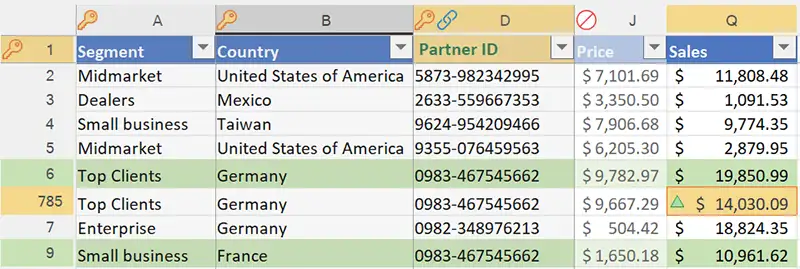
Now you have comparison report on your screen. All the rows are aligned one versus one. Corresponding values are exactly on the same places.
Values in column Price are shown with muted color. This means that column is ignored and all cells in this column are excluded from the comparison.
Changed cells
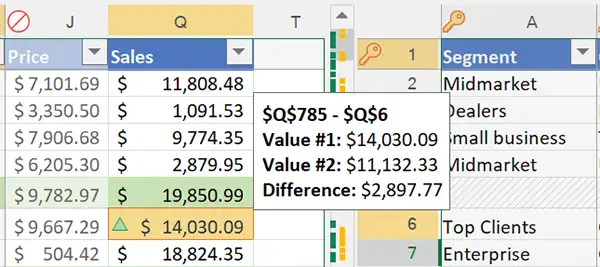
All cells that was changed are highlighted with orange color in the report.
If you move your mouse over highlighted cell, xlCompare gives you detailed information about difference found in this cell.
For the numeric cells xlCompare displays difference between two values.
Added and Removed rows
Added row is a row from the left file, that doesn't have corresponding row in the right one. It is highlighted with green background color.
Similar to this, deleted row is a row from the right file, that doesn't have corresponding row in the left worksheet. xlCompare highlights it with red color.
You can change colors used to highlight changed cells and unique rows in the application options window.

Filter cells in the comparison report
If your worksheet contains 100000 of rows, it is not a good idea to browse all the rows one by one to analyze changes. There are several filtering commands that presents you with a updated and equal data in your table.

All Cells
This is default mode; you see all compared cells. No filtering is applied.
Any time you need to cancel filtering and display all records you can use this command.
Matching Rows
Displays only identical values in both tables. If row contains only one updated cell it becomes hidden.
This command gives you a quick answer to the question: Are there any identical cells in two columns in Excel tables.

Updated Rows
This filter shows all rows that have changed cells.
Use this command to focus only on the updated values in your tables.
If you need to report changed cells to your colleague or them in the presentation, just right click on one of the sheets and ally Save | Only Visible Rows command. xlCompare saves filtered rows in the Excel file on disk. You can send it by email and transmit in other way.

Unique Rows
Rows that don't have matching rows on the other sheet. This command displays only red and green rows.
Unique cells, shown by this filter may indicate consistency errors in your data or missing records in the reports you are getting.

Filter data in report
How to find a quick answer to question like this:
Are there any changes in the Midmarket segment that belong to USA region?
Just apply filtering for the Segment and Country columns. This filter works like in Excel.

xlCompare synchronize filters in the left and right panels, so you should not repeat this action on the right side.
Both worksheets are filtered and you have data for the selected marketing segment on your screen.
To extract it from this worksheet you can just select all cells and press Ctrl+C. All the visible cells are now copied into clipboard.

Highlight changed cells
Use command Mark Changes With Color on the Home tab on Ribbon. This command marks every changed cell with color. All unique rows receive red and green formatting.
This is a way to permanently mark differences in two Excel columns with color and save them on disk.
Save changed cells into other file
To save only changed cells in the other file on disk, please do the following:
Apply Updated Cells filter
Use Save | Visible Rows command from the right click menu in the worksheet window
xlCompare asks you for a file name and saves data in this file on disk. Very easy method to extract the data you need from the comparison report.
Exit from comparison
To exit from the comparison report and back to the normal worksheet view use Close Report command on the Home tab.
Also you can press the ESC button to get your comparison report closed.
Unhide the columns back
How to unhide the columns in the worksheet windows?
First method. Select all columns and use Unhide command in the right click menu.
Second method. Go the Manage Columns dialog using right click menu. Click on the heading word Hidden to get all items unchecked and apply.
Third method. Just close xlCompare and reopen your files.
Back to the previous comparison
If you need to repeat the same operation once again and analyze the data, should you reconfigure hidden columns, linked items and so on.
xlCompare saves previous comparison including what columns was hidden, linked, and ignored.
Use Recent Items command on the Ribbon. It reopens previously opened files, restores context of the comparison and presents you results.
So, you should not configure your files again if you know this simple trick.

Find bold or colored values in two columns in Excel
How to find cells that are marked with bold formatting in two columns. Can this be done in the xlCompare.
Just in a few clicks you will have results on your screen.
Compare cell formatting
In most cases cell formatting is not important. Different text alignment option may give you 200000 differences you need to analyze. This may look confusing.
So, default option is to ignore cell formatting when we compare cells.
You can enable this anytime in the Options:

Compare two lists and get colored rows
Now use Compare Sheets button on the Home tab and get comparison report on your screen. Changes in the cell formatting are detected and highlighted in the report.
All cells with changed styles are highlighted with yellow background color in the worksheet window.

Filter only colored rows in your sheet
Now apply Updated Rows filter. You have only colored rows on your screen.

Save selected data into Excel file
Apply already discussed command Save | Visible Rows from the right click menu to save visible data on disk.
Compare columns in three Excel sheets
Can xlCompare be used to compare data in three Excel columns at once?
Compare three Excel files
xlCompare has an option that compares 3 Excel files for differences. Usually, this option is used when you compare 2 files that have same base version. You need to see what was changed in every file in comparison with the base version.

Compare three columns in Excel files
This mode can be used to compare three columns for differences. We need to ignore other columns on our worksheets to exclude them from comparison and compare only values we have in specific columns.
Enable 3-file mode
To enable 3-way comparison, use 3 File command on the Home tab. It opens additional panel for the third file in xlCompare.
Now you can drop 3 files into the application.

Configure compared worksheets
Let's ignore all the columns except first one in these files. Open Manage Columns dialog from the Right Click Menu and uncheck the MSRP and Price columns.
Get 3 columns compared
Use Compare Files command to get the results. xlCompare finds matching values in three columns in Excel files and present you difference report

Highlight the changes
To permanently highlight the differences, use Mark Changes with Color command.
More information
To get more information on how xlCompare compares 3 files, please visit this page:
Conclusion
So, let's make a conclusion and summarize advantages you are getting by using xlCompare for comparing columns in Excel files for differences and matches.
Proc
xlCompare is a easy to use application that perfectly does spreadsheet comparison and merging. This tool is a real timesaver in many cases. Armed with xlCompare you can do complex tasks in a seconds.
Cons
Possible xlCompare has one minus - this tool is not free. You can use it during evaluation period, but after it expires you need to order a license.

Why xlCompare is an ultimate tool
xlCompare can be used in various cases that requires spreadsheet comparison. Following advantages makes this tool ultimate utility for Excel file comparison:
Easy to use
Application has very clear and native interface, that is very similar to Microsoft Excel.
Effective
xlCompare makes you effective in your daily work with Excel. This saves you a lot of efforts and working time.
Clear results
You are getting clear and easy to understand comparison results. You can see examples on the screenshots above.
Reasonable price
Actual price of xlCompare is amount of time spent to spreadsheet comparison multiplied by your hourly rate. So, the application has reasonable price in comparison with other tools on the market.
Lifetime license
xlCompare is sold as a lifetime license. You don't need to pay more for this tool. License includes upgrades to all future versions of the xlCompare and support.
Now we have version 11 on the website. If you order it now, you will be able to upgrade it to xlCompare 12, xlCompare 15 and so on.
You never lose your license.
xlCompare makes complex work simple!
I have a question
Please, describe your question or inquery in the form below. We will be happy to respond you!
Contents
- Compare columns cell-by-cell
- Use EQUAL operator
- Use IF function operator
- Compare two unordered lists
- Use VLOOKUP function
- Use MATCH function
- Filter mismatching items
- Use Conditional Formatting
- Conclusion
- Benefits of choosing xlCompare
- Compare 2 columns step by step
- Find bold and colored cells
- Compare three columns at once
- How xlCompare can help you
Join Our Reddit Community